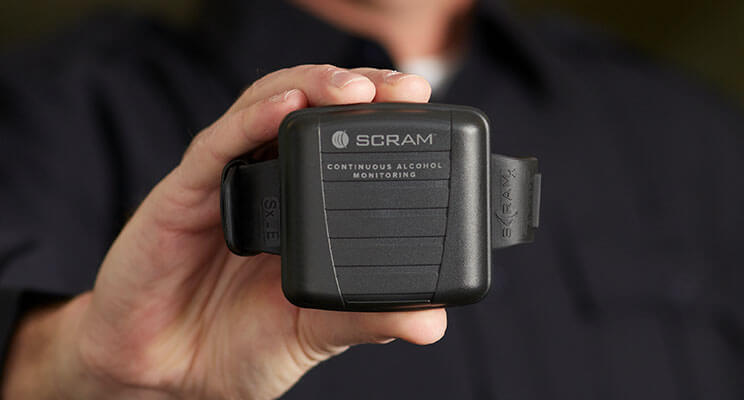
False Positive Rates, False Negative Rates, and Positive Predictive Values are specific diagnostic test statistics that have been evaluated as part of rigorous testing protocols of SCRAM Continuous Alcohol Monitoring® (SCRAM CAM®) devices. Diagnostic test results have been reported in a host of independent field and laboratory testing studies over the past fifteen years. To date, peer-reviewed and published literature have shown SCRAM CAM to be a scientifically accurate and reliable transdermal alcohol monitoring instrument. Furthermore, the literature shows little to no evidence of any false positives in field and laboratory settings. One study (Barnett, et.al., 2014[1]) noted that the false positives found were likely the product of self-reporting error.
With any research, we encourage readers to digest the information presented through a critical lens. We suggest the reader consider the author’s hypotheses, methods, available data, and conclusions prior to generalizing any results to a broader population outside of a given study (external validity).
External validity (generalizability) of field and laboratory studies is often overlooked[2]. Many factors must be accounted for when evaluating external validity. The setting of the study, participant selection, and differences between study protocols and real-world environments greatly impact the relationship between study results and generalization to wider populations. Thus, directly applying a false positive rate from a field or laboratory study may lead to miscalculating the true number of potential false positives in the general population.
In 2012 AMS released results from an internal study that showed a False Positive Rate (FPR) of 0.074% per 12-hour period. A recent meta-analysis of the available literature and further internal studies have revealed an FPR of 0.14% per 24-hour period. The difference in these FPRs is simply the result of unique study methodologies and presentation of findings. The diagnostic test statistics found in SCRAM CAM studies have remained remarkably consistent across time.
Looking at South Dakota as an Example
Over a 13-year period, 2,494 confirmed drinking events[i] were found over 2,157,185 monitored days (MD)[3]. This shows a CDE Rate of 0.115% (CDE Rate = CDE / MD = 2,494 / 2,157,185 = 0.00115). When compared to the CDE rate from our internal study[4] (12.58%; CDE / MD = 406 / 3,228 = 0.1257) we find the real-world rate of drinking events to be one one-hundredth of those found in a controlled environment. This is the result of key differences between the populations. Participants in controlled field and laboratory settings have volunteered to wear a CAM device, are encouraged to drink as they normally would, and are not at risk for legal consequences. Conversely, real-world populations are court-ordered to wear a CAM device, not consume alcohol, and face legal sanctions or jail time if they drink. While the external validity from our internal study does not allow for directly comparing results to the real world, one can easily see that applying a false positive rate from a controlled environment to real-world populations does not make sense.
We have found that applying the Positive Predictive Value (PPV = 99.51%) to the number of confirmed drinking events more closely represents the number of potential false positives in a real-world sample. While PPV is heavily reliant on the population sample and prevalence of drinking within the population[5], this result closely resembles false-positive findings from internal participant testing, third-party peer-reviewed publications, and customer results from real-world populations.
[1] Barnett N.P., Meade E.B. and Glynn T.R., (2014) Predictors of detection of alcohol use episodes using a transdermal alcohol sensor. Experimental and Clinical Psychopharmacology, 1(22): 86–96.
[2] Rothwell, P. M., (2005) External validity of randomized controlled trials: “To whom do the results of this trial apply?”. Lancet, 365, 82-93.
[3] Office of the Attorney General: South Dakota (2019) 24/7 Program statistics. Retrieved from: https://atg.sd.gov/legal/DUI247/statistics.aspx
[4] Alcohol Monitoring Systems (2012) Secure Continuous Remote Alcohol Monitor: SCRAM (Courtroom Presentation). Retrieved from: http://www.trafficresourcecenter.org/Impaired-Driving/~/media/Microsites/Files/traffic-safety/tms/Courtroom%20Presentation.ashx
[5] Molinaro, A. M., (2015) Diagnostic tests: how to estimate the positive predictive value. Neuro-Oncology Practice, 2(4), 162-166.
[i] The process for confirming a drinking event as actual consumption includes human analysis and the application of mathematical algorithms that ensure any confirmed drinking event was actually consumption, not environmental alcohol. For further information see our SCRAM CAM FAQs.

